

MOTIVATION
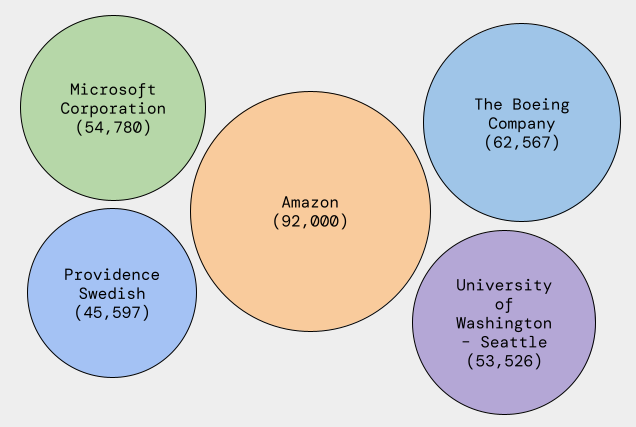
Washington State is dominated by high-tech industries: The Boeing Company led aerospace and manufacturing in the Pacific Northwest since WWII. IT giants Microsoft and Amazon are headquartered in the Seattle metropolitan area with other major tech companies being T-Mobile and Nintendo of America.
The New York State economy, while more diverse, has a rich history of manufacturing and technological innovation. Upstate New York was a major hub for manufacturing everything from typewriters to Carrier air conditioning units and Franklin cars. While manufacturing has since drastically declined, tech companies like IBM, Bloomberg, and hundreds of different startups call New York home.
These major industries have immense resources and a high interest in education. They require people with specialized skills to fill thousands of open positions and will need more as time goes on.
In what ways are these major industries shaping education?
What is the extent of their influence?
One way companies have influenced education is through pushing for Career and Technical Education (CTE). CTE aims to equip students with more specialized skills rather than a broader liberal education. This webpage takes a tour of efforts to promote CTE, zooming into New York and Washington as case studies into how these efforts are materialized into programs and curriculums.
There are three big questions this project aims to answer:
- How are corporations influencing K-12 through CTE?
- Are efforts to promote CTE in K-12 improving outcomes?
- Are the efforts to promote CTE equitable?
SECTION 1: THE SYSTEM
The Problem of Inadequacy
Before diving into the constitutional language, school finance laws, and legal decisions regarding the education systems in New York and Washington, it is helpful to first see an example.
The Shanker Institute provides excellent information on school finance and adequacy. The institute calculates adequacy using the National Education Cost Model (NECM). Through analyzing data from the School Finance Indicators Data System (SFID), Stanford Education Data Archive, and the NCES EDGE System — School Neighborhood Poverty Index, a regression model can be created to account for various factors and estimate adequate per pupil spending. These factors, which can drastically affect the ability for a district to provide an efficient education, include poverty, the proportion of ELL students, and economies of scale. What is considered “adequate” is how much the model predicts spending should be, based on the various factors, in order to achieve average outcomes (test scores in reading and math for students in grades 3–8). [2]
A large issue of adequacy is that it is context dependent. While two areas can spend roughly the same amount per pupil, some areas may need more money to educate each pupil. This difference can drastically affect whether spending is truly adequate. As a compounding factor, poorer districts need more money but may lack the ability to increase funding. A stark example of this can be found in Washington state, comparing Mercer Island School District (MISD) and Toppenish School District (TSD).
Mercer Island is situated on Lake Washington. It is connected to the rest of the state via I-90 floating bridges. Immediately west is Seattle and east is Bellevue. For parents of children in Mercer Island School District, 89.9% have a bachelor’s degree or higher and the average household income is $250,000. It is 65% white. [3]
Toppenish is east of the Cascades, in the Columbia Plateau where the largest industry is agriculture, inside the Yakima Indian Reservation (though the school district is under the state). The median household income for parents of children in the school district is $77,573, 76% of the community is Hispanic or Latino, and 38.2% of parents did not graduate high school or do not have an equivalent. [4]
They spend roughly the same per pupil on education: between $17,100 and $17,500.
Below is the adequacy:
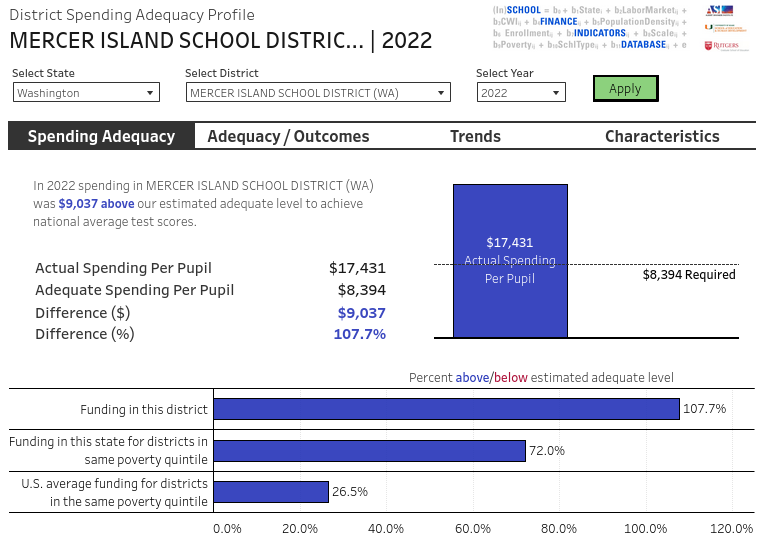
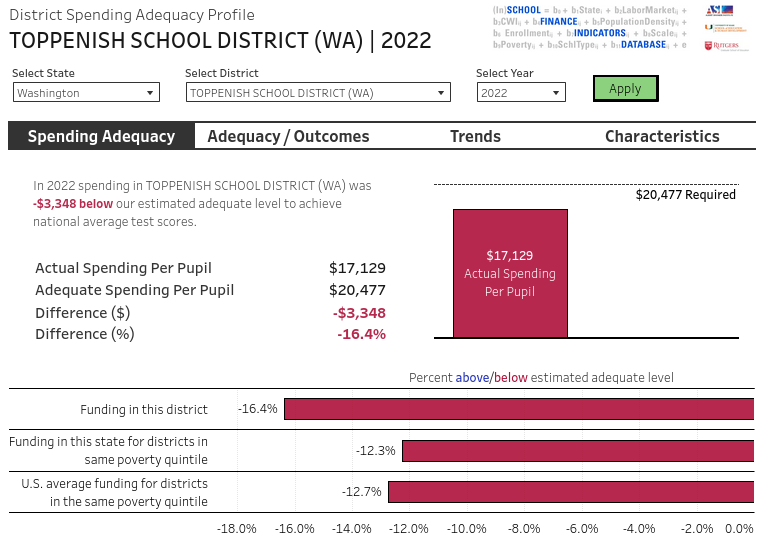
We see similar spending, more effort in Toppenish given the fact that the average income is less than a third compared to Mercer Island, but the ability to meet adequate spending levels is drastically different.
If TSD and MISD were in a race where spending per pupil is their speed and adequacy is the finish line, the difference between Toppenish and Mercer Island school finance is not that Toppenish is running slower, it’s that it has to go twice as far.

Constitutional Language and Finance
“The legislature shall provide for the maintenance and support of a system of free common schools, wherein all the children of this state may be educated.” — New York State Constitution Article IX Section 1 [7]
New York’s Constitution has terse language provisioning the creation of a public school system, simply stating it will be free and available to all children. Nowhere does it mention technical schools or vocational education.
Starting in 1993, Campaign for Fiscal Equity (CFE) v. State of New York lawsuit argued that New York was underfunding schools, in violation of Article IX of the State Constitution. CFE I in 1995 defined the constitutional duty of the state to provide the opportunity for children to have a “sound basic education.” CFE II in 2003 found that New York City schools had failed to provide a “sound basic education” by underfunding schools. CFE III in 2006 then defined steps for remediation, including increased aid and the creation of a new Foundation Aid formula. [8]
The Foundation Aid formula works by accounting for several factors:
- The number of students and weighted cost per student (e.g. students in poverty, ELL, and special-ed students on average require more resources) termed pupil need index (PNI)
- The regional cost index (RCI) to account for wage differences in areas
- Inflation via the consumer price index (CPI).
The expected local contribution is subtracted to return foundation aid. More wealthy areas are expected to have greater local contribution and the state will pay less whereas poorer areas will receive more state funding. [8]
In the New Yorkers for Students’ Educational Rights v. State of New York lawsuit filed in 2014, the State was again accused of inadequately funding schools by not fully funding according to the Foundation Aid formula.
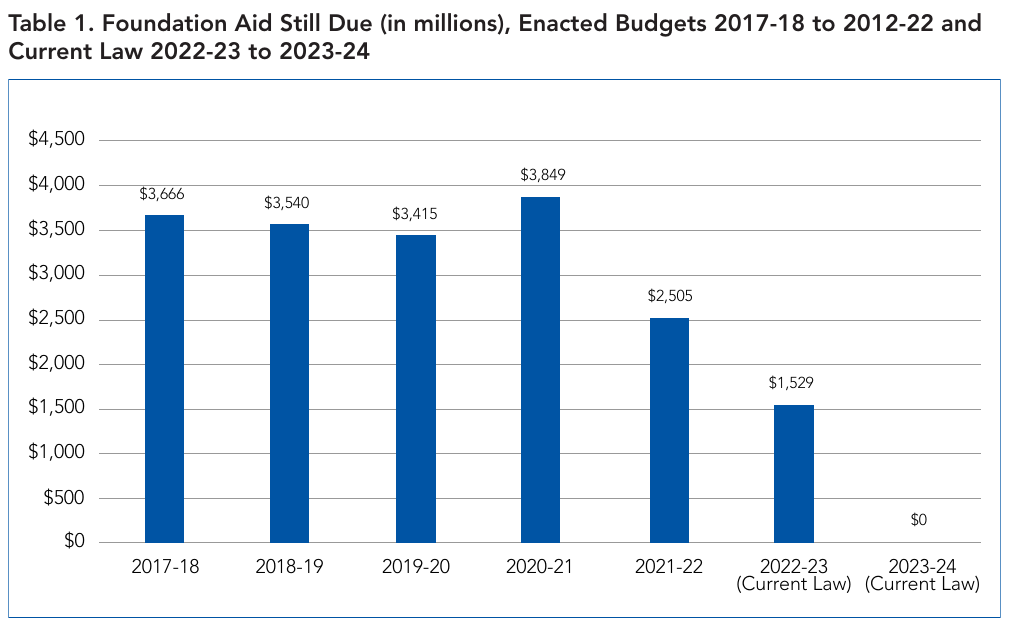
The case was resolved in 2021 when the State reached a settlement to phase in the money to fully fund the Foundation Aid formula, to the tune of a $4.2 billion increase. The 2023–24 school year marks the first time the state has fully funded schools. [10]
“It is the paramount duty of the state to make ample provision for the education of all children residing within its borders, without distinction or preference on account of race, color, caste, or sex.” — Washington State Constitution Article IX Section 1 [11]
“Washington’s constitution makes public schools the main job of the state, implying that everything else, from prisons to roads to universities, is extra” — Donna Blankinship, Associated Press [12]
The Washington State Constitution specifies the creation of a common school fund and state tax for a uniform, public school system. Its strong language, calling the provision of education its “paramount duty,” has become a point of contention in the history of Washington’s K-12 funding.
In the 1978 case Seattle School District No. 1 v. State of Washington [14], the State Supreme Court ruled that the State had failed to fulfill its duty to adequately fund schools with regular tax revenue (as opposed to primarily relying on local levies). This prompted the State legislature to pass the Basic Education Act of 1977. The Act defined a minimum number of days of school hours per day, certified teacher to student ratios, and a formula for basic education. [15]
The issue of school finance came up again in the 2012 lawsuit McCleary, et al. v. State of Washington where it was alleged that the State was not amply funding schools. It was found that “[the] State has not complied with its article IX, section 1 duty to make ample provision for the education of all children in Washington” and “[ample] funding for basic education must be accomplished by means of dependable and regular tax sources.” [16]
Two years after the decision, from 13 August 2015 to 7 June 2018, the State was charged $100,000 per day by the Court for failure to comply. Fees charged by the Court against the State totaled over $150 million. [15]
Today, Washington State uses the General Apportionment formula, which is based on a prototypical school funding model, to determine the level of state funding for schools. The General Apportionment formula is only to set a base amount of state funding for schools; there is other legislation for more targeted programs like special-ed and levies. The formula considers a hypothetical, prototype school system with defined staff to student ratios, types of staff, salary levels, and needed materials. From this base, the formula uses district-specific information to generate the amount of funding it should receive. The final step is multiplying the “regionalization factor.” To account for teachers working in areas with a higher cost of living and supposedly keep salaries competitive, funding is scaled based on property values — the regionalization factor. Places that have higher property values receive more state funding and places with lower property values receive less. [17] In some areas, the regionalization factor increased state funding 18 percentage points from base funding.
An immediate problem with the regionalization factor is that it does the exact opposite of closing funding gaps in regard to the ability for different communities to raise local revenue for schools via property tax. From our previous example, Mercer Island School District, easily one of the wealthiest districts in the state of Washington, is one of the main beneficiaries of the regionalization factor.
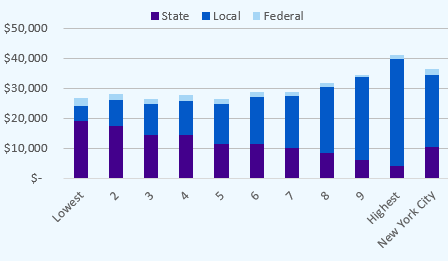
Nevertheless, the State has drastically increased funding for schools since the McCleary Decision. In most states, the average state and local funding is about equal (with much variance between districts). In New York, about 40% of school funding is from the State and 56% from local sources [8]. In Washington, state funding accounts for 78% of K-12 revenue compared to 15% from local levies [18]. Also of note, Washington State, unlike many other states, does not have a personal income or corporate income tax. Its primary revenue source is sales tax and business and occupation (B&O) tax [19].
With regard to CTE, the Constitution states that the public school system will include technical schools but gives no detail on the nature or purpose of the technical schools.
Adequacy and Performance
We’ve seen quite drastic reforms in both New York and Washington to increase state funding for schools. Have these efforts paid off?
Now analyzing state-level adequacy and performance, annual one-page state finance reports are also created by the Shanker Institute. The reports assign scores for states based on three areas: fiscal effort (spending compared to GDP), statewide adequacy, and equal opportunity (adequacy between the lowest and highest poverty districts). The 2023 reports for New York and Washington state are shown below:
New York has high fiscal effort and high adequacy but low equal opportunity. In fact, it ranks the worst in equal opportunity. There could be many reasons for this. One is that richer areas are still able to spend so much more on education that state funds are unable to close the gap. Reforms that have resulted in low rates of inadequacy could also have decreased the will to close disparities. Results could also be skewed by New York City which has highly segregated schools.
Washington has high adequacy but low fiscal effort and low equal opportunity. While the McCleary Decision has motivated the State to spend more, there is still more that could be spent relative to the State’s enormous GDP. The low equal opportunity could also be explained by a variety of reasons, another being the regionalization factor mentioned before.
SECTION 2: EFFORTS TO PROMOTE CTE
History
The history of CTE and vocational education in America is long and complex. Here is a timeline that gives a “brief” summary.
The Smith Hughes Act was the first piece of legislation that specified providing federal funding for vocational education in high schools. While the timeline and many sources will call the Smith Hughes Act the start of CTE in America, there have been many other pieces of legislation to promote vocational education in higher ed. For example, the Morrill Act of 1862, which motivated the creation of Cornell, required that states create colleges specializing in “agriculture and the mechanic arts” (promoting these subjects was explicitly stated in the full name of the act) [22]. HBCUs and industrial education were championed by Booker T Washington in the 1880s. The difference is that the Smith Hughes Act was the first to apply to secondary education, when Mann’s common school movement resulted in a more formal system of public education that was set in the early 1900s (Mississippi was the last state in the Union to pass a compulsory education law in 1918).
One of the most critical pieces of legislation for CTE was the Vocational Education Act of 1963 (VEA) which was created to help maintain and expand vocational education programs. It authorized funding to states based on population and per capita income and allowed for a youth work-study program.
It has been reauthorized and amended several times, and starting in 1984, legislation has been named in honor of the late House Representative Carl D. Perkins of Kentucky. The most current iteration is the Strengthening Career and Technical Education for the 21st Century Act, informally known as Perkins V.
How it Works Today
Perkins V attempts to give room for states to navigate implementing CTE and making continuous progress. The general idea is as follows:
- Use a formula that takes into account population and poverty levels to determine how much money should be allotted
- Establish metrics for performance
- Have states create their own plans for accountability
- Local entities gather data on local needs then create plans and request funds from the State
It should be noted that federal funds in Perkins V are meant to supplement, not supplant state funding for CTE. If the federal government finds that a state exerts less fiscal effort per student in a preceding year, it will receive reduced funding from the federal government [23].
In Washington State, the General Apportionment formula gives enhanced funding towards CTE, as CTE is recognized to require more resources per student. For example, the funding formula for a typical high school uses a class size of about 28–29 whereas for CTE, the average class size is set to 23. [24]
By contrast, in New York State where most CTE programs and spending are through BOCES, districts will pay BOCES for resources and there is additional BOCES state aid [25].
For high schools that implement approved CTE courses, such as an elective computer science class perhaps under PLTW, funding can come from a wide range of sources — everything from federal sources outside of Perkins V to state grants, and private grants, on top of the base amount for a typical class and maintenance.
For FY25, New York had $64,414,903 in funding for CTE, 52% towards secondary education [26] while Washington had $26,026,060 in funding with 44% towards secondary education [27].
As part of accountability, Perkins V defines core indicators of performance and program quality. These indicators focus on the educational attainment and outcomes for CTE concentrators (defined as students who complete at least two credits of CTE in a single pathway). These indicators include the rate of high school graduation, standardized test scores, going into advanced training or government service after exiting secondary education, and more. States have to report core performance indicators but can pick what to set as the program quality indicator (5S3) out of three different options. [28]
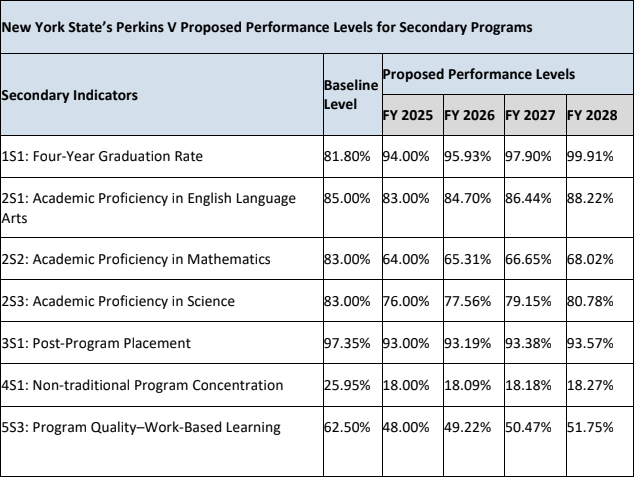
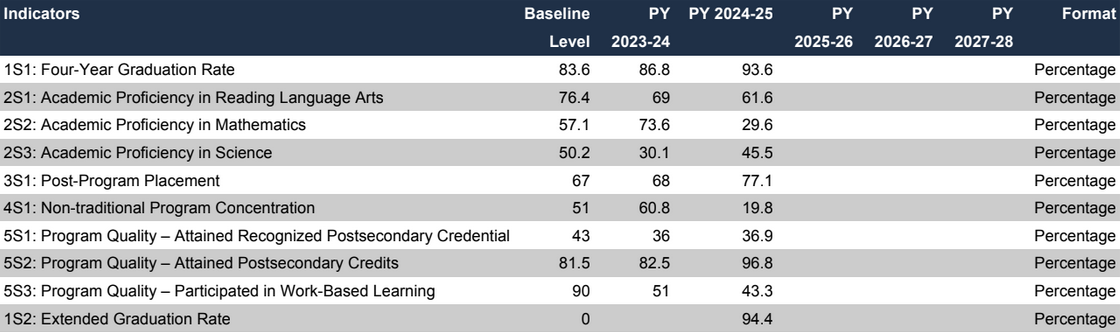
States are required to submit four-year plans. Here are the plans for New York and Washington:
Public-Private Partnerships
Project Lead The Way (PLTW)
Project Lead the Way (PLTW) is a nonprofit organization founded in 1997 that aims to increase STEM-focused education in schools. They develop curriculum in math, engineering, computer science, and biomedical science; train teachers; and offer grants for schools to adopt their curriculum. They report having trained over 116,000 teachers and have had their curriculum offered in over 12,600 schools across the country. Schools that have adopted PLTW STEM courses include Ithaca High School in New York and my alma mater, Mountlake Terrace High School in Washington. PLTW works with industry and university partners in developing their curriculum and offering additional programs to students.
Pathways in Technology Early College High School (P-TECH)
P-TECH was created as a collaboration between IBM, New York City Public Schools, and the City University of New York. It offers a pathway of CTE courses starting at grade 9 and culminating in earning an associate’s degree — all at zero cost to students [32]. Participating businesses will give people who have gone through P-TECH preference in hiring. In addition to IBM, these partners include Amazon, Tesla, and Microsoft [33]. Some other ways business partners are involved include offering mentoring, worksite visits, speaking engagements, and internships.
Core Plus
Core Plus is a public-private partnership to promote manufacturing skills, similar in structure to New York’s P-TECH. It was founded by the Boeing Company and Washington State schools. Unlike P-TECH which covers six years of CTE courses, Core Plus consists of two years in high school — the “core” year and the “plus” year. The first year consists of learning the basic skills of working in a shop: safety, measurement, drilling, cutting, soldering, etc. In the second year, students can specialize into one of three different sectors: aerospace, maritime, or construction.
Vocational Schools and Skills Centers
BOCES
As discussed previously, one of the major problems in educational adequacy is economy of scale. Rural areas have a more difficult time offering diverse opportunities to students because they lack resources and have insufficient demand to justify costs. The Boards of Cooperative Educational Services (BOCES) was created by the New York State legislature in 1948 as a way to address issues of economies of scale. In the mid 50s, it branched out into vocational education and the system exploded from a few pilot programs to a massive statewide network. [34]
One board is TST BOCES which serves the counties of Tompkins, Seneca, and Tioga. TST BOCES offers traditional CTE classes in areas including construction, manufacturing, nursing and public safety as well as a more specialized P-TECH Academy program. It is open, for free, to junior and senior high school students and they will earn credits for graduation. [35]
Skills Centers — Sno-Isle TECH
While Washington state does have Educational Service Districts (ESDs) that are administratively similar in that they pool resources together, ESDs do not have the same level of focus towards CTE. However, Washington state does have several skills centers that provide CTE for multiple school districts.
One skills center is Sno-Isle TECH which is open to high school juniors and seniors in Snohomish and South Island counties. Depending on their school, students will attend an AM or PM session and are bussed from their home school to the center. Equivalent credit [36] is offered for attending.
Sno-Isle TECH touts 20 programs and five pathways: trade and industry, human services, and information technology.
Skills centers receive support from various community partners. In the case of Sno-Isle TECH, partners include local fire departments, grocery stores, car dealerships, auto repair shops, Boeing, and Sound Transit (the transportation authority for the Seattle area). These community partners, through the Sno-Isle Skills Center Foundation, provide mentorship, give scholarships, and collaborate on curriculum.
SECTION 3: EVALUATION
How are Corporations Influencing K-12 Through CTE?
Lobbying For CTE
Over 2017 to 2018, IBM has made 13 lobbying reports mentioning H.R. 2353 — Strengthening Career and Technical Education for the 21st Century Act. Boeing has seven over the same time period. Other companies include Dell, John Deere, Honda, Toyota, Siemens, Intel, and Microsoft. [37]
Here is an example of an LD-2 disclosure form by IBM that includes lobbying for H.R. 2353:
While it lists $1.62 million in expenses, it is mixed with lobbying for emerging technologies, defense, and trade which makes it difficult to tell how much goes towards technical education.
PLTW Funding
Some of PLTW’s “transformative” partners, organizations donating over $1 million, include Amazon Web Services, Chevron, John Deere, Lockheed Martin, Toyota, Verizon, and Intel. [39]
Their form 990 filing reports over $64 million in revenue in 2024, though a detailed breakdown of how much is received by each corporate partner is not required to be publicly reported. Its revenue from contributions and grants was about $14.8 million, though the contributions are from a mix of different sources, public and private. [40]
Creating Technical Curriculum
Corporate involvement in the creation of school curriculum raises key questions about the purpose of schooling.
One could draw connections to past debates over liberal arts and vocational education as a means to economic and social progress. Are we giving our children a path to prosperity or are we allowing corporations to shovel children into highly specialized jobs that stunt their potential?
The prospect of having public schools and corporations work to develop technical curriculum presents a golden win-win opportunity. Schools are given support to develop relevant curriculum and connect their students to potential employers. Businesses are able to close the gap between qualified applicants and open job positions.
On the other hand, vocational education has been used to “track” low-income students and minorities away from college into low-paying jobs. While there have been attempts at reform, overspecialized education pushed by companies has been a real concern for families. In a 2022 study [41], parents of children in CTE programs were interviewed about their experiences and perception of corporate influence. There were several areas of concern pointed out: companies presenting information through the “prism of their products,” pathways narrowed down by region to funnel people in certain areas into certain careers, and having children choose CTE pathways far too early.
In an article for The Progressive by the same study authors Jeff Bryant and Velislava Hillman, they describe how corporations are using CTE to disguise private interests.
“Businesses work their way into schools by donating money and resources to education programs. Oil and gas companies, for example, give pro-petroleum curriculums to schools. Defense contractors sponsor school math contests and robotics competitions. Dominion Energy and Amazon contract with districts to provide curriculum, technology, and instructional services.” [42]
A particularly clear example of corporate influence through CTE was in 2019 where Cajon High School students in San Bernardino were offered an “Amazon Logistics and Business Management Pathway.” In the pathway, students would make visits to Amazon facilities and learn the fundamentals of leadership, management, and streamlining processes [43]. The cost for Amazon? Aside from helping create the curriculum, they gave a $50,000 grant to the school, $10,000 less than the lowest paid teacher in the San Bernardino City Unified School District in 2019 [44].
Are Efforts to Promote CTE in K-12 Improving Life Outcomes?
Secondary Performance Indicators
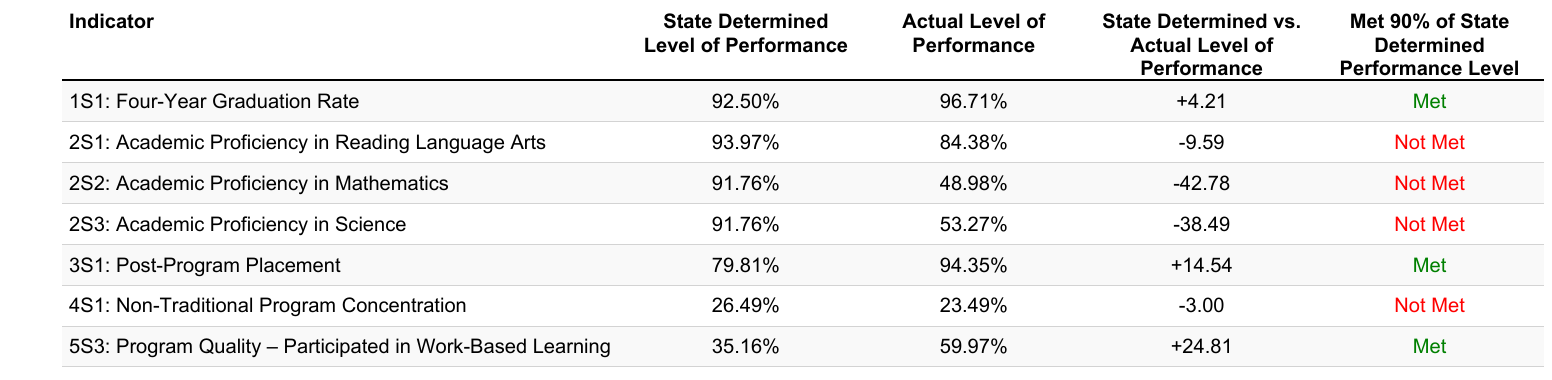
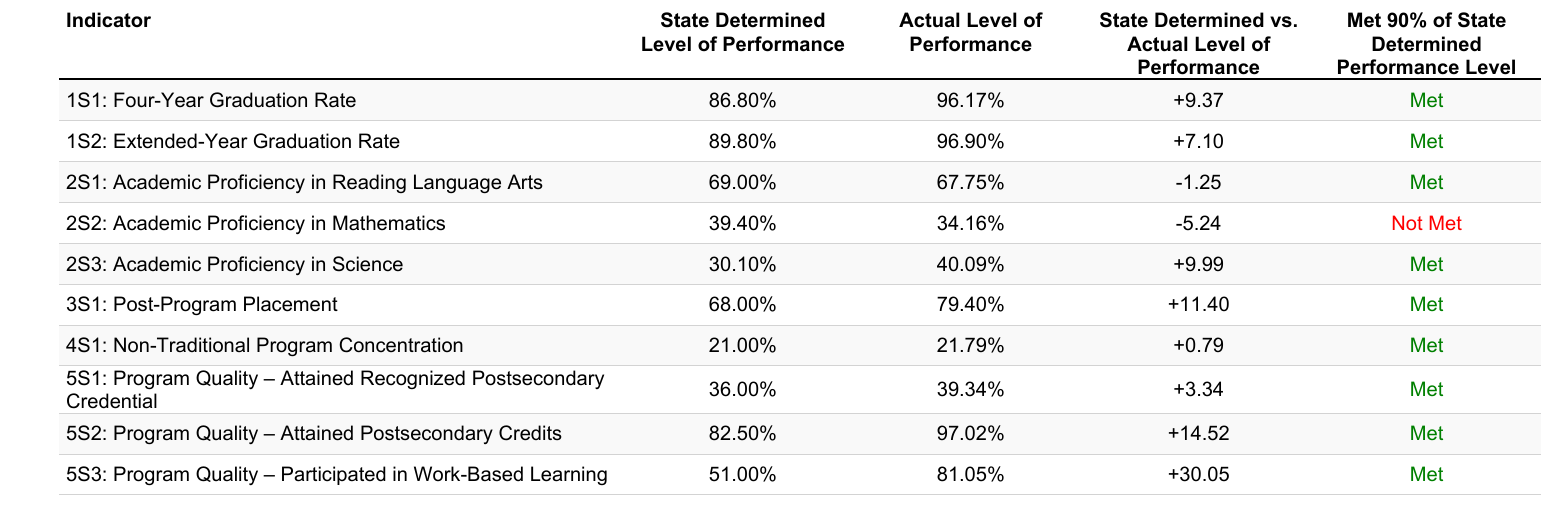
New York has met far fewer of its performance targets for the 2023–24 school year compared to Washington State. Particularly, New York has not met any of its academic proficiency targets. However, zooming into the numbers, we see that it is significantly outperforming Washington in terms of actual performance; New York sets much higher targets than Washington. Looking at program quality, both states are far exceeding their program quality benchmarks, particularly as measured by participation in work-based learning where Washington has about 20 percentage points greater participation than New York.
Employment in STEM
One of the main attractors for schools, families, and students that choose CTE is the prospect of having a clearer path to employment after graduation. Simultaneously, businesses can benefit from having an increased talent pool and reduced training needed. The connection from high school to career with CTE is broad with everything from summer internship opportunities to paid associates degrees and interviews upon completion.
Project Lead the Way has a “PLTW Alumni Making a Difference” series that showcases the work of PLTW alumni. Below is an example episode showcasing one person’s path from classroom to internship (connected through PLTW by Lockheed Martin, a sponsor), to becoming a full-time employee and systems engineer.
Full playlist: PLTW Alumni Making a Difference [47]
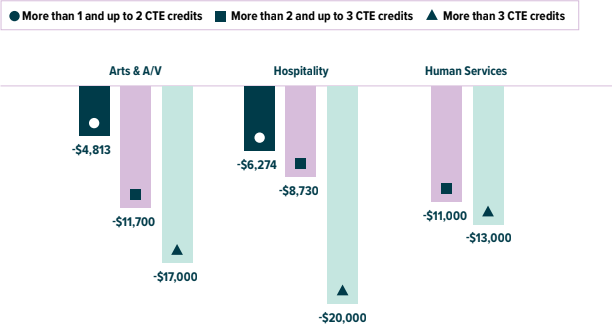
Various studies support the claim that CTE studies can improve labor market outcomes, though there is nuance. A 2025 study by Education Northwest on CTE in Washington State found that those who earned CTE credits in agriculture, construction, manufacturing, and transportation had significantly higher cumulative earnings six years after high school graduation. Furthermore, concentrating on a single pathway generally increased earning even more. [48]
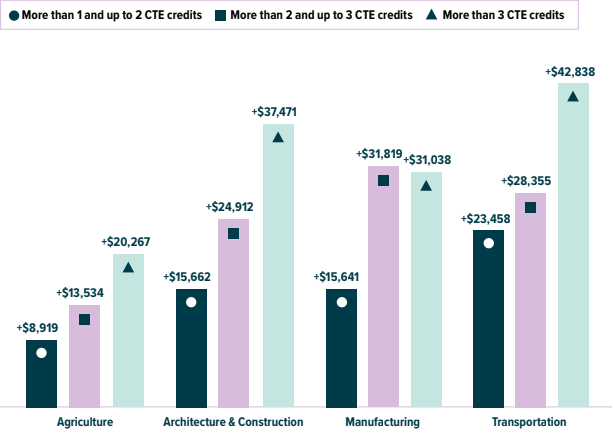
However, for some pathways, earnings were decreased. This could be attributed to the nature of the careers such students enter.
Educational Attainment
Current data shows a correlation between CTE and higher high school graduation rates. In New York, the average graduation rate for 2024 was 86% [49] while the CTE concentrator graduation rate was 96.71% [45]. For Washington, the overall average graduation rate was 82.8% while the CTE concentrator graduation rate was 96.17%.
The aforementioned study by Education Northwest found that Washington students with one credit of CTE were 5.7 percentage points more likely to graduate high school. High school graduation rates further increased with more CTE credits — students with at least three CTE credits were 12 percentage points more likely to graduate. [48]
The relationship between CTE and postsecondary education enrollment is a bit more complicated. Overall, for students with at least three CTE credits across all pathways, they were 1.6 percentage points less likely to enroll in postsecondary education but 2.1 percentage points more likely to be employed. However, different pathways yielded different rates of postsecondary enrollment. Students in finance, marketing, health, and IT were more likely to enroll while students in agriculture, construction, government, manufacturing, and transportation were less likely to enroll. [48]
Are the Efforts to Promote CTE Equitable?
Fair Opportunity
CTE programs are reaching every corner of the country. Pooling resources with systems like BOCES in New York and skills centers in Washington have done well to overcome barriers to access, even for rural areas. There are still some gaps: in Washington, suburban areas tend to have the most available pathways while rural areas have the fewest, but interestingly, CTE credit attainment was relatively consistent regardless of school locale and income [48].
Current discourse on CTE access seems to be less on the existence of programs but instead who is placed into what — i.e. ensuring all walks of life enroll in the entire range of CTE offerings rather than having select groups go to one path or another.
From a policy brief involving discussion with practitioners of CTE programs, several issues regarding equity were raised: [50]
- Getting helpful and accurate information from advisors on CTE opportunities
- Ensuring information about high-quality CTE programs reaches all students
- Overcoming the stigma that “CTE is only for low-income students not bound for college”
Enrollment and Demographics
| Metric | New York | Washington |
|---|---|---|
| Public high schools | 1,147 | 437 |
| Public high school enrollment | 796,152 | 348,814 |
| CTE concentrators | 50,064 | 36,152 |
| Total secondary CTE enrollment | 96,575 | 186,569 |
In New York, about 57% of secondary CTE enrollment is male compared to 43% female [26]. In Washington, there is a smaller gender enrollment gap with 53% male and 47% female [27].
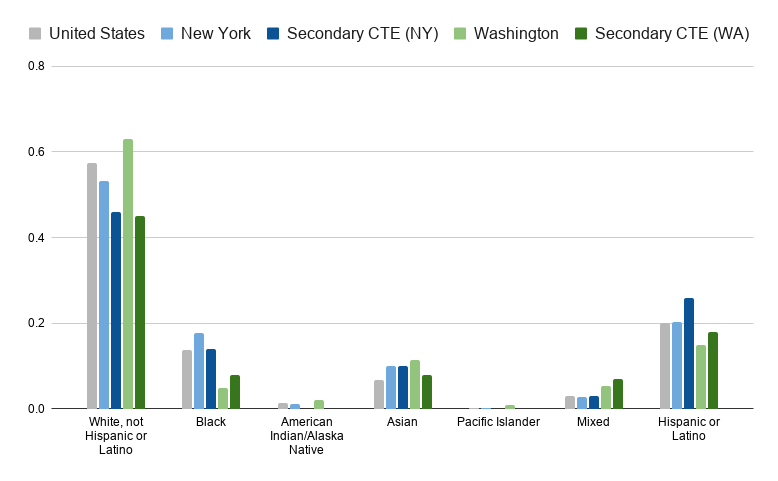
For both New York and Washington, enrollment in secondary CTE for white students is lower compared to the overall population, and for Latino students enrollment is high.
SECTION 4: DISCUSSION AND RECOMMENDATIONS
Corporate Influence
There are two different ways to view the involvement corporations have with the K-12 system in creating and running CTE. The first view is that public schools and corporations are collaborating for the benefit of all parties involved: students, companies, the economy, and taxpayers. Schools want to provide a more varied curriculum for students who are interested and generate a larger return on investment, families want the security that schooling will guarantee their children employment, and companies want a labor pool of well-educated, qualified people. Public schools can provide the structure for delivering education while corporations can ensure curriculum aligns with industry, provide mentorship and internship opportunities, and even provide additional funding for different programs.
The other view is that corporations are using CTE to extract free, hyperspecialized employee training at the cost of taxpayers and to the detriment of students.
States need to consider defining appropriate boundaries when collaborating with private interests. This may include defining under what conditions it is appropriate to take grants from corporations if at all, ensuring curriculum comes from a variety of sources, taking community input on CTE courses, etc. Schools also need greater transparency regarding their relationships with companies. There needs to be reporting on exactly what companies are involved and the extent of their involvement: how much money is contributed, what parts of curriculum did they develop or collaborate on, and whether they share data.
Risks of hyperspecialization can also be curbed by emphasizing taking more foundational classes that can be applied to multiple fields at once before greater specialization. For example, the Core Plus curriculum’s first year consists of core subjects that all students in the program take before choosing a particular concentration. Rather than having students choose upfront a particular pathway, taking progressively more specialized courses at a time could be helpful.
Equity and Accountability
As emphasized in an aforementioned brief on equity in CTE, there needs to be greater focus on recruiting a diverse population of students and overcoming stigma regarding career and technical education [21]. We need to break from the old view of vocational education as a place to stick lower-income students and minorities that cannot afford or get into college. The brief suggests effort towards rebranding, marketing, and speaking with parents to overcome concerns. From the demographics data, there seem to be more minorities enrolling in CTE. Further research should be done into not just the pull but the push factor for this gap — are certain students being drawn to CTE or do they feel cut from the opportunity to go to college?
On accountability, standards need to be adjusted and more uniform data must be collected. There are Comprehensive Local Needs Assessments (CLNAs) created with state-designed templates and updated every two years. While Perkins V performance indicators are required to be reported nationally, more detailed information on actual labor market outcomes to answer questions on earnings and controlling for demographics and socioeconomic status needs to be done and enforced at a national level. While Washington State had a quite comprehensive report on the effectiveness of CTE, following outcomes immediately after graduation and six years after with a longitudinal study design, this should be a requirement under Perkins.
Sources
- Business Journal — Largest employers in Washington State by headcount
- Shanker Institute — National Education Cost Model (NECM)
- NCES EDGE — Mercer Island School District demographics
- NCES EDGE — Toppenish School District demographics
- School Finance Indicators Data System — Adequacy data visualization
- IMDB — The Dictator (2012) film image
- New York State Constitution, Article XI
- Fiscal Policy Institute — Understanding Foundation Aid in New York State
- ASBO New York — Foundation Aid gap report (2022–23)
- AQENY — Settlement in NYSER v. State of New York (2021)
- Washington State Constitution, Article IX
- Donna Blankinship, Associated Press — Washington State school funding (2015)
- OSPI — Washington State education funding chart
- Seattle School District No. 1 v. State of Washington (1978)
- McCleary et al. v. State of Washington — Washington Supreme Court decision
- Washington Supreme Court — McCleary enforcement opinion
- League of Education Voters — How We Fund K-12 Schools in Washington (February 2025)
- OSPI — Understanding Public School Funding in Washington
- Washington State Department of Revenue — Income tax information
- School Finance Indicators Data System — State school finance profiles 2026
- ACTE — A Brief History of CTE: Timeline (December 2021)
- National Archives — Morrill Act of 1862
- Cornell Law — 20 U.S.C. § 2391: Perkins V supplement, not supplant provision
- Washington RCW 28A.150.260 — CTE funding formula
- NYSSBA — BOCES fact sheet
- ACTE — State CTE Profile: New York
- ACTE — State CTE Profile: Washington
- Congress.gov — H.R. 2353, Strengthening Career and Technical Education for the 21st Century Act
- NYSED — New York State Perkins V four-year plan
- Washington Workforce Training and Education Coordinating Board — Washington State Perkins V plan
- CBC News — P-TECH segment (YouTube)
- NYSED — Pathways in Technology (P-TECH) program
- P-TECH — Industry partners
- BOCES of New York State — A history of BOCES
- TST BOCES — Career and Technical Education
- Sno-Isle Skills Center / Mukilteo Schools — Equivalency credit
- OpenSecrets — Lobbying on H.R. 2353 (Perkins V), 2017
- IBM LD-2 Disclosure Form (U.S. Senate lobbying disclosure)
- PLTW — Transformative partners ($1M+)
- ProPublica Nonprofit Explorer — PLTW Form 990
- Bryant & Hillman (2022) — Corporate influence in CTE programs (Taylor & Francis)
- Bryant & Hillman — "Big Business Is Colonizing the Classroom," The Progressive
- VICE — Amazon-sponsored high school course at Cajon High School
- Transparent California — San Bernardino City USD teacher salaries (2019)
- U.S. Department of Education — CTE data (PCRN): secondary enrollment and performance indicators
- PLTW Alumni Making a Difference — Ep. 2: Amy Hughes (YouTube)
- PLTW Alumni Making a Difference — full playlist (YouTube)
- Education Research & Data Center — CTE in Washington State: longitudinal study on student access, participation, and outcomes
- NYSED — New York State graduation rate (2024)
- MDRC — Practitioner Perspectives on Equity in Career and Technical Education
- U.S. Census Bureau — QuickFacts: United States
- U.S. Census Bureau — QuickFacts: New York
- U.S. Census Bureau — QuickFacts: Washington